This blog post is the third in a series of posts about STAR voting. If you haven’t read the previous entries, I recommend you start with the first entry before reading this one.
Last post I explained why the 5-star ballot format used by STAR voting is superior to other commonly proposed ballot formats. In this post I’ll explain how the ballot format and voting method can be adapted for use in pre-election polls, and I’ll go over the advantages of doing so. At the time of writing no one has ever conducted a STAR voting pre-election poll, and neither the Equal Vote Coalition nor STAR Voting Action have set a standard for how this would be done. However, there is a straightforward means of transforming the STAR voting method into a pre-election poll method, and it’s this polling method that I’ll be discussing here.
A STAR voting pre-election poll, or STAR poll for short, begins by having poll respondents rate the candidates using the same 0-5 scale that STAR voting uses. Once all responses have been collected, the poll results can be calculated. These results consist of two parts. The first is the average score of each candidate. While STAR voting uses total scores to determine the finalists, it makes more sense to report average scores since they are independent of the number of respondents. This is analogous to how single-choice plurality voting elects the candidate with the greatest total number of votes, but poll and election results are commonly reported as percentages rather than totals.
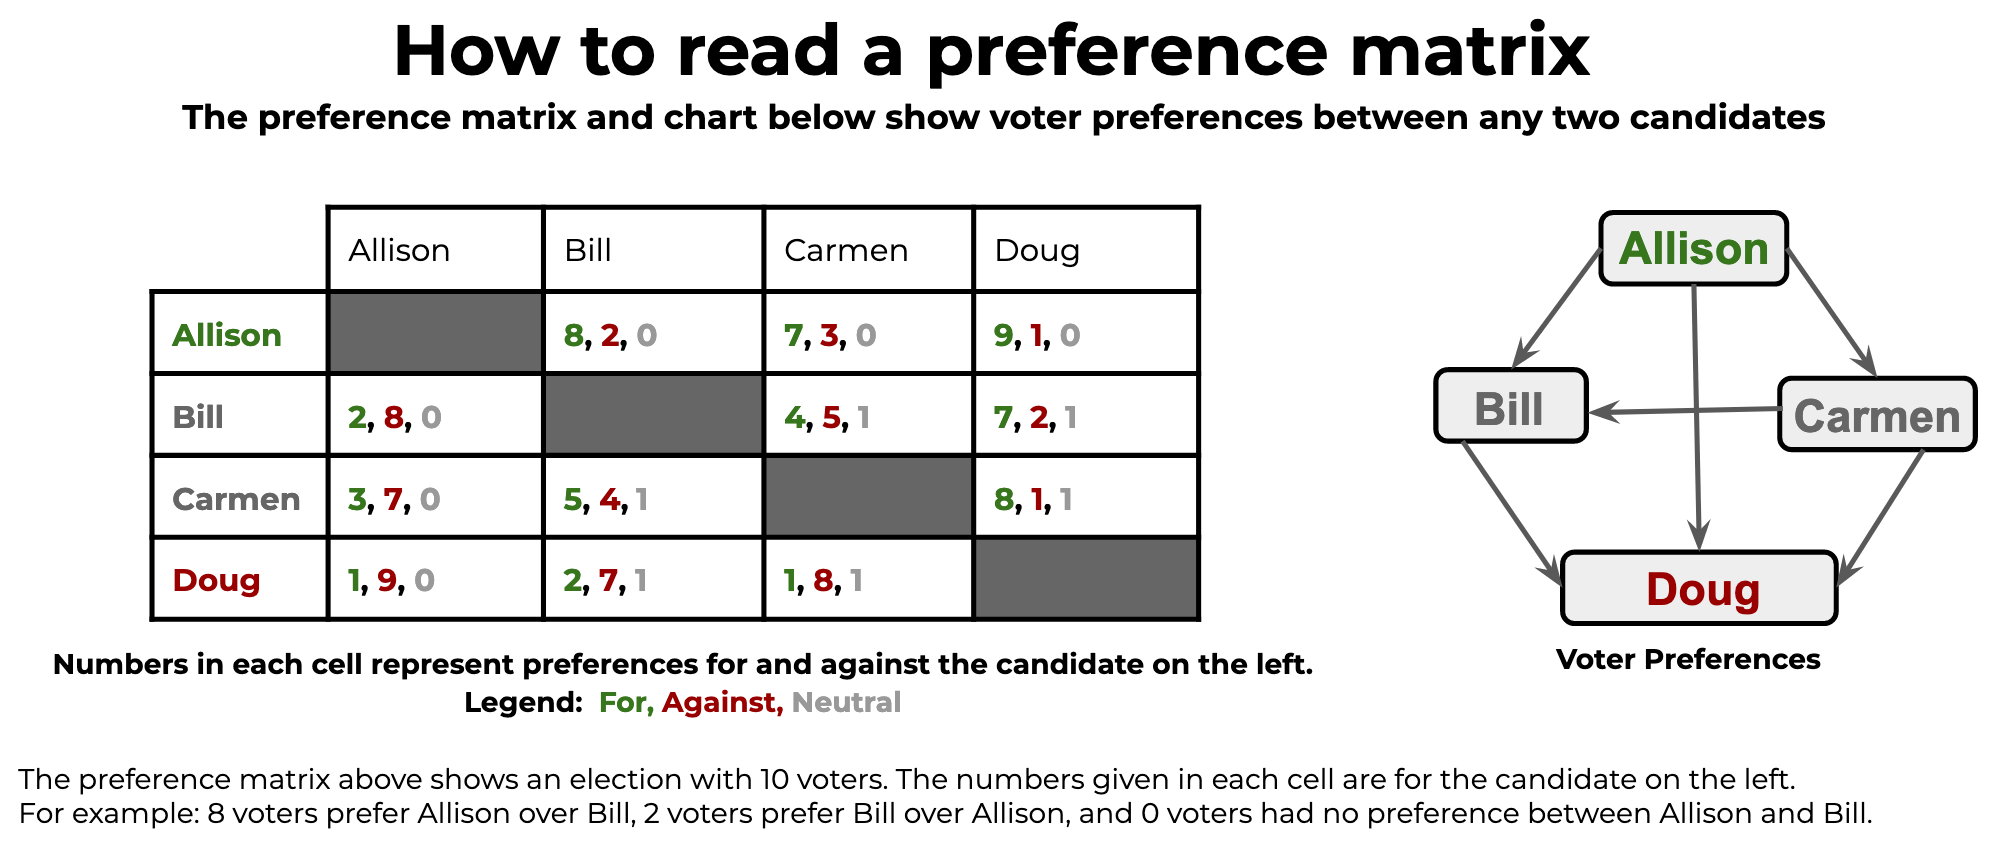
While the score part of the STAR poll is straightforward, the second portion of the results is a little more involved. It consists of a pairwise preference matrix, which is simply a chart that shows how many voters prefer each candidate to every other candidate. For each pair of candidates, the example preference matrix below contains the number of voters who prefer the first candidate to the second, the number of voters who prefer the second to the first, and the number of voters who didn’t express a preference between the two.
Preference matrices in poll results will likely look a bit different from the one above. First of all, they’ll generally give percentages rather than raw totals. Secondly, they will just have one number in each box, corresponding to the percentage of voters who preferred the row candidate to the column candidate. Thus, they will look more like the example below.
| ...over Allison | ...over Bill | ...over Carmen | ...over Doug | |
|---|---|---|---|---|
| Prefer Allison… | 80% | 70% | 90% | |
| Prefer Bill… | 20% | 40% | 70% | |
| Prefer Carmen… | 30% | 50% | 80% | |
| Prefer Doug… | 10% | 20% | 10% |
For this chart, the 90% in the top right indicates that 90% of voters prefer Allison to Doug. Unlike the previous chart, the number of voters who are indifferent between two candidates is not explicitly stated, but it can be found easily. For instance, the percentage of voters who are indifferent between Bill and Carmen is 100% - 50% - 40% = 10%.
While this isn’t too complicated, it can be a little overwhelming, especially when there are many candidates in the election. Because of this, I expect that poll results will often include a simplified version that only contains the candidates with the highest scores. In the extreme case, the pairwise results may only be reported for the two highest-scoring candidates, in which case a matrix is unnecessary.1
The preference matrix and average scores together provide a lot of information about the election. The average scores serve as independent measures of how popular each candidate is relative to the others in the race.2 The pairwise results can reveal the existence of a Condorcet winner, a candidate who beats every other candidate in head-to-head elections, or they can reveal that no such candidate exists. Most polls don’t come anywhere close to providing this level of information.
Consider a single-choice plurality poll. Since voters only give their top choice, it doesn’t provide an independent measurement of each candidate’s popularity. A candidate might be broadly popular with the electorate but have this support hidden since most of their supporters like another candidate slightly more. Such a poll also generally won’t provide any information about how candidates would perform in head-to-head elections against each other, since many voters won’t have either candidate in the matchup as their first choice.
Ranked choice voting3 polls can be better than this, though they aren’t always. Ranked choice polls in the United States generally have voters rank however many candidates they will be allowed to rank during the actual election. A ranked choice election is run on the poll results, and the totals for each round are reported. Below is an interactive visualization of a ranked choice poll conducted during the early 2020 Democratic Primary when there were 19 candidates in the running.
This presentation helps to simplify the results, but it does so at the cost of preventing you from seeing the totals from every round at once, which can make comparing totals across rounds annoying. Nevertheless, this is probably one of the best formats for presenting ranked choice poll results with this many candidates.4
One observation about these results is that because ranked choice voting only counts some rankings, many candidates have most of their support hidden. In this example, 13 candidates never made it past 5% support, and the only 4 candidates to get above 10% support already had over 10% support in the first round. Looking at the honest assessment scores from the same poll, it’s clear that candidates had much more support than the ranked choice poll revealed.
Ranked choice elections and polls are relatively new in the United States, but Australia has used ranked choice voting to elect its House of Representatives for over a century. The established polling methodology for these elections is the two-party-preferred vote. Under this polling method, all candidates except those from the two major parties are eliminated, and votes go to whichever of those candidates was ranked higher. The results of this method are essentially the same as the results of a single-choice plurality poll in which voters can only choose one of the two major party candidates, and so have all the downsides associated with plurality polls. It’s also worth noting that the two-party-preferred vote methodology only works because Australia’s House is two-party dominated.5
Approval polls do a better job of avoiding this trap. Under an approval poll, voters choose to approve as many candidates as they want to, and the percent of voters approving each candidate is reported. Similarly to the score portion of a STAR poll, this yields an independent measure of each candidate’s popularity. However, approval results tend to somewhat underestimate candidates’ support since voters can’t indicate that they partially support a candidate.6 This means that approval polls more accurately reflect candidates’ support than ranked choice polls but are still less accurate than STAR polls.
But why is it important for polls to give accurate information about how much support the candidates have? The answer has to do with strategy. Under pretty much every voting method, casting a strategic vote involves first identifying the frontrunners in the election. In the absence of good polling, voters will default to assuming that the frontrunners are the two candidates from the major parties. And this assumption itself can go on to affect later poll results. A single-choice plurality poll may show that the major party candidates are frontrunners not because they’re the most popular candidates, but because the voters being polled assumed they were the only candidates with a chance of winning and thus ignored all the others.
So the strategy under plurality voting is just to vote for whichever frontrunner you prefer, but what about other voting methods? Under ranked choice voting, the safest option is to make a frontrunner your first choice, though you can generally get away with ranking candidates that have no chance of winning above a frontrunner. How do you find out if a candidate has no hope of winning? The same way you learn which candidates are frontrunners: by looking at the polls. If ranked choice polls underestimate candidates’ support, then most voters won’t bother looking into whether they’re worth supporting. The few voters who love them will be able to safely rank them first, but that alone won’t be enough to make them viable.
Approval voting manages to do better here. The strategy under approval is to approve the frontrunner you prefer and every candidate that you like more than that frontrunner. Since approval polls do a pretty good job of accurately capturing candidates’ support, the frontrunners are likely to be the two candidates that are most popular with the electorate. But approval’s lack of expressiveness means voters may feel obligated to approve one of the major party candidates even if they truly don’t approve of either. Thus, there’s still a risk that the two major party candidates will be able to earn enough approvals to look like the true frontrunners even though another candidate is really more popular than them.
STAR voting is able to get around this problem. The strategy under STAR is to give the frontrunners different ratings so that your vote can help defeat the frontrunner you dislike most in the automatic runoff. So if under honest voting you would give both frontrunners a 0, under strategic voting you’ll want to give the one you prefer a 1. Importantly, this gives voters the option to indicate a preference between the frontrunners without fully supporting one of them. These preferences will be visible in the preference matrix, but at the same time they won’t noticeably distort the average scores, so the perceived frontrunners won’t have their popularity artificially inflated.
STAR polls combine the opportunity to avoid supporting both frontrunners (while still differentiating between them) with independent scores that serve as highly reliable measures of the support each candidate has. This means STAR polls can both collect voters’ preferences accurately and display those preferences accurately, a feat most other polling methods are unable to match. This is important because voters rely on polls to determine which candidates are worth paying attention to and how to vote strategically in the actual election. Other voting methods like single-choice plurality and ranked choice voting tend to have polls that exaggerate the support of major party candidates and underestimate the support of other candidates, leading to two-party domination.
In the final post of the series, I’ll talk about what I consider to be the most important property of a voting method: the quality of the winners it selects. For now though, I hope this post has helped you to understand what makes polls important and why STAR pre-election polls are so great compared to the alternatives (and for extra credit, you can think about how the properties that make STAR voting great for polls can carry over to the process of choosing winners in elections).
-
A preference matrix is also unnecessary for the top three candidates, since there are only three matchups to consider. For the top four candidates there are six matchups to consider, and past that point using a preference matrix will generally be the better option. ↩
-
It might sound like a contradiction to say that the scores are both independent and relative, but it isn’t. Saying that the scores are independent just means that you can adjust one candidate’s score without needing to change any of the others’ scores. The adjustments themselves are still relative to the other candidates’ scores, they just don’t affect those scores. ↩
-
In this post I use the term ranked choice voting to refer solely to its single-winner form, instant-runoff voting. ↩
-
Another option for visualizing ranked choice voting results is the Sankey diagram. ↩
-
A better term in this case might be two-faction dominated, as one of the factions, Coalition, is technically composed of multiple parties. However, the two main parties in the Coalition, the Liberal Party and the National Party, tend to act more like two wings of the same party than like two separate parties. ↩
-
The 2020 Democratic Primary poll has an example of this, though the effect may be exaggerated since the approval results represent how voters would vote under approval while the score results represent voters’ honest assessments of candidates. ↩